The Cummings Affair - We’ll know in just over a week whether it mattered

Dominic Cummings famously declared that he didn't care about appearances-he'd stuck to the letter of the law and that's all that matters. It sounds like an unsympathetic insurance company wriggling out of a claim but I'm prepared to give him the benefit of the doubt because the real issue, for me, is that appearances do matter. And we'll be able to tell in about a week's time whether I'm right.
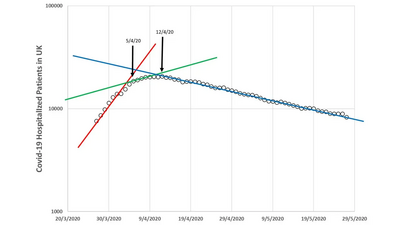
When "government scientist", Neil Ferguson, and Scotland's chief medical officer, Catherine Calderwood were exposed for flouting lockdown regulations they immediately understood the implications. They're scientists and it was obvious to them that, even if their actions only changed the behaviour of a small percentage of people by a very small amount, this would lead to real additional deaths of real additional people. The only way to avoid this was to step down without delay and without self-justification. So that is what they did. The graph above demonstrates that their actions did the trick!
So, what are you looking at? The graph shows the total number of people hospitalized in the UK by Covid-19 and how this has changed over the last few months. The data is taken from the UK government and is shown, here, as black circles. Each of the three, roughly straight, sections corresponds to an approximately constant "R-value". Upward slopes correspond to R bigger than one and downward slopes correspond to R less than one. So what we're seeing here is changes to R as a result of changes in all our behaviour.
Initially, there was a rapid rise in hospital bed usage (indicated by the red line) but, from about the 5th of April, this flattened considerably (see the green line). This was probably the result of the lockdown which came in on March 23rd. We'd expect a delay between lockdown and hospital admissions simply because it takes time to go from being infected to being sick enough to need a hospital bed. If the slow-down after April 5th was indeed the result of the lockdown then the implication is that the delay is about 13 days.
But what about that very significant change, from hospital-admission growth to hospital-admission decline, after about April 12th? What happened 13 days before that? What happened around March 30th?
It may be a Boris Johnson effect. We heard that our Prime Minister had tested positive for corona-virus on March 27th and, by the end of the month, it was pretty clear that he was not at all well. Did this shock the nation into taking lockdown more seriously? If it did, then Boris Johnson's unfortunate illness, and his decision to immediately make it public, may have saved thousands of lives.
So what about Catherine Calderwood and Neil Ferguson? Their stories broke around April 4th and May 5th respectively and 13 days from those dates gets you to April 17th and May 18th. There is no convincing evidence of changes in my graph around those dates. Small fluctuations perhaps but nothing I would consider statistically meaningful. This is why I think their prompt action, in stepping down, was effective.
That, finally, brings me back to Dominic Cummings. Accusations that he flouted the rules were first made a week ago and so we'd expect any effect to show up on the graph in about a week's time. It may take a few further days after that for any change in trend to be undeniable but I'll be looking very closely. In fact, I'm going to stick my neck out and make a prediction, today on May 30th, that we will see an increase in hospital-bed usage starting around June 6th. If we do, then Dominic Cummings is wrong to believe that appearances don't matter.
I really hope it's me that's wrong though. I really hope that there is no increase in hospitalizations or in fatalities. However, any such happy outcome will be because the British people were selfless and intelligent enough to continue sticking to the rules despite the poor example from the top.
About the author
David Waltham is Professor of Geophysics at Royal Holloway, University of London where he has spent the last 35 years undertaking mathematical analysis and mathematical modelling of complex geological and geophysical data. He lives in Marlborough and is married to Jo Waltham, the Liberal Democrat Parliamentary Spokesperson for the Devizes Constituency. You can check whether his predictions come true by following daily updates to his Covid-19 tracker that can be found at https://estfs.rhul.ac.uk/covid-19-introduction/.